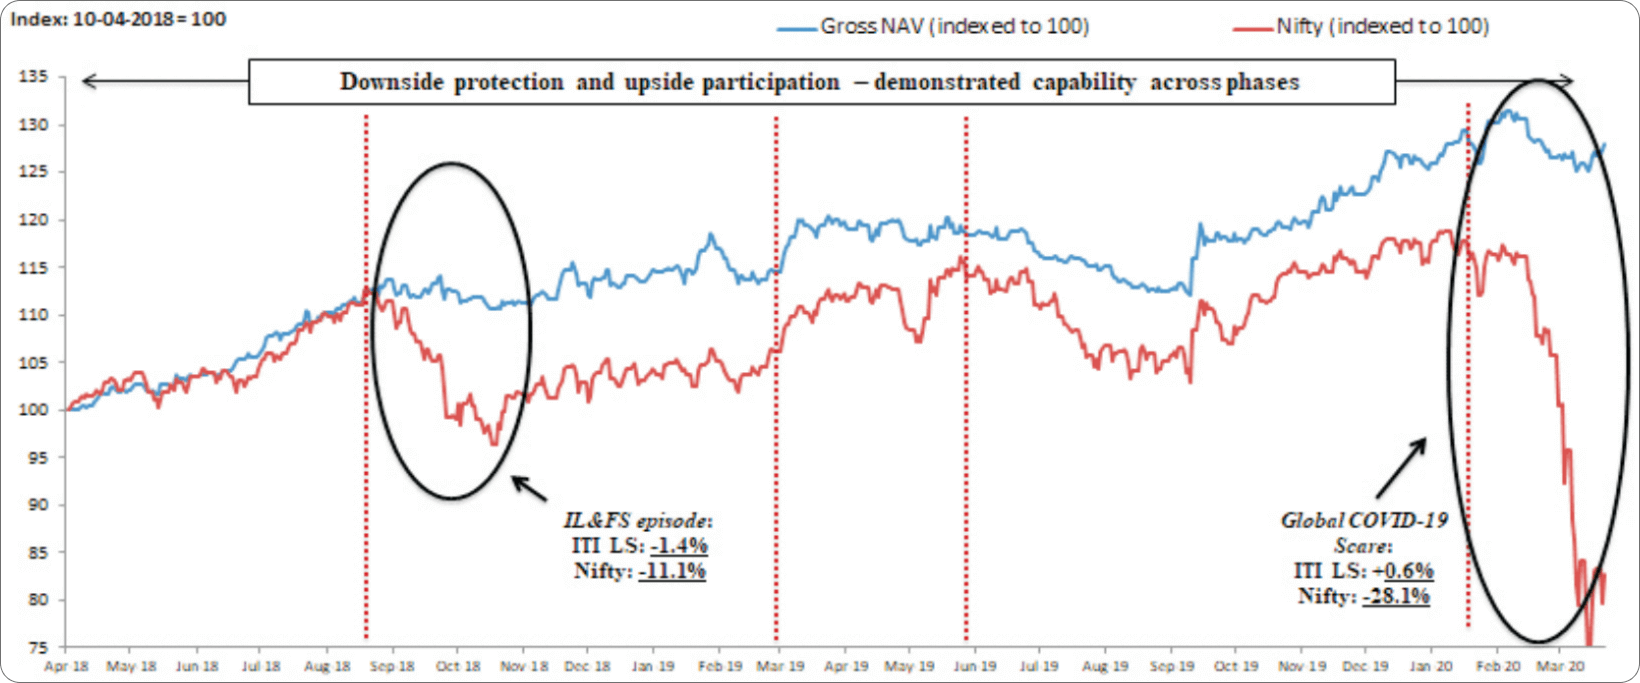
Performance
Invests in secular and high quality businesses and franchises at attractive prices (typical range 25% - 60% exposure)
Tactical Portfolio

Manage risk exposures whilst navigating the volatile Indian equity markets

Manoeuvre portfolio positioning through tactical long and short exposures

Short book focused on deteriorating business cycles, companies with mis-governance, market breadth positioning etc

Earn fixed income (liquid fund) returns on unutilized cash when market opportunities are limited
Portfolio And
Key Terms
| Top Strategic Long Positions | |
|---|---|
| Stocks | % Wt |
| HDFC Bank | 6.10% |
| HDFC Limited | 4.70% |
| Infosys | 4.00% |
| Reliance industries | 3.90% |
| Bharti Airtel | 3.70% |
| Top Tactical Long Positions | |
|---|---|
| Stocks | % Wt |
| Dr. Reddy Labs | 1.10% |
| Top Tactical Long Positions | |
|---|---|
| Stocks | % Wt |
| Dr. Reddy Labs | 1.10% |
| Nature Of The Fund | CAT III AIF, open-ended Fund |
|---|---|
| Ideal Investment Horizon | At least 24 months |
| Gross & Net Exposure | Max Gross exposure: 200% Typical Gross exposure: 80-120% Typical Net exposure: 25-60% Range of Net Exposure – (15%) to 100% |
| Long & Short Holdings | Typical number of Long Holdings – 12 to 18 Typical number of Short Holdings – 10 to 15 |
| Management & Performance Fee | Option 1- 1 Cr - Fixed Fee 1.5% | 15% performance over 10% Hurdle Option 2 - 1 Cr - Fixed Fee 2.5% | No performance Fee Option 3 - >10 Cr - Fixed Fee 2% | No Performance Fee Option 4 - >10 Cr - Fixed Fee 1 % | 15% performance over 10% Hurdle Option 5 - >10 Cr - Fixed fee 0.5% | 20% performance fee over 10% Hurdle. Performance fee to be charged annually every financial year or upon withdrawal of funds by the client on pro-rata basis, whichever is earlier. |
| Exit Load | 2% if redeemed within 1 Year |
| Minimum Investment | INR 1 Cr. |
| Taxation | Tax paid at fund level, gains taxed as capital gains or business income at fund level depending on whether it is from investment or trading strategy, respectively. |
Performance
Delivered one of the highest alpha by any domestic fund manager; generated 26% absolute returns vs Nifty’s -18% since its inception
Product Risk
Portfolio risk and exposures are constantly reviewed for all types of risks. The liquidity risk in the portfolio, risk of changes in economic variables (such as currency, interest rates etc), sector exposure, individual company exposure, portfolio of liquid funds are all evaluated on an ongoing basis
| Positioning | % Return Since Inception** |
|---|---|
| Strategic Long | -1.7% |
| Tactical Long | 6.5% |
| Tactical Short | 12.0% |
| Liquid | 9.5% |
| Total | 26.4% |
| Key Ratios* | ||
|---|---|---|
| ITI LS Fund | Nifty | |
| Sharpe Ratio | 1.27 | -0.37 |
| Annualized Standard Deviation | 7.18 | 22.24 |
| Superior Risk Return Ratios |
| Apr-18 To Aug-18 | Sep-18 To Feb-19 | Mar-19 To May-19 | Jun-19 To Jan-20 | Feb-20 To Mar-20 | |
|---|---|---|---|---|---|
| ITI LS Fund | 12.59% | 0.71% | 4.60% | 7.21% | 7.21% |
| Nifty | 12.29% | -7.60% | 10.47% | 0.33% | 0.33% |
| Gross Returns | Q1 FY 19* | Q2 FY 19* | Q3 FY 19* | Q4 FY 19* | Q1 FY 20* | Q2 FY 20* | Q3 FY 20* | Q4 FY 20* | Since Inception |
|---|---|---|---|---|---|---|---|---|---|
| ITI LS | 5.32% | 7.38% | 0.62% | 4.57% | -0.75% | -1.14% | 6.64% | 1.51% | 26.41% |
| Nifty | 3.00% | 2.02% | -0.62% | 7.00% | 1.42% | -2.67% | 6.04% | -29.35% | -17.35% |
| * From 11Th April 2018 To 30Th June 2018. Inception Date – 11Th April 2018, Figures Are Net Of Operational Expenses |
|---|